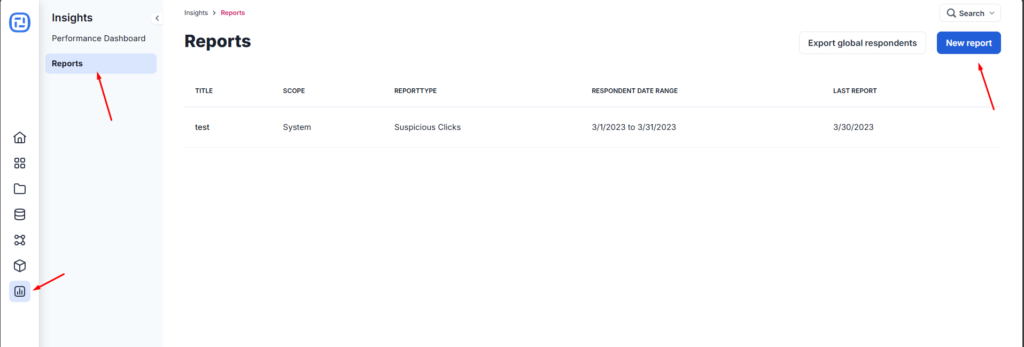
On the left menu of your Ion console, under the new Insights feature, you will find both Performance Dashboard and Reports.
The Performance Dashboard page has all data available from your experiences at a single overview, which can be seen by applying the provided filters, including Portfolios, Campaigns, Creatives and URLs as well as a predefined time range or a custom one.
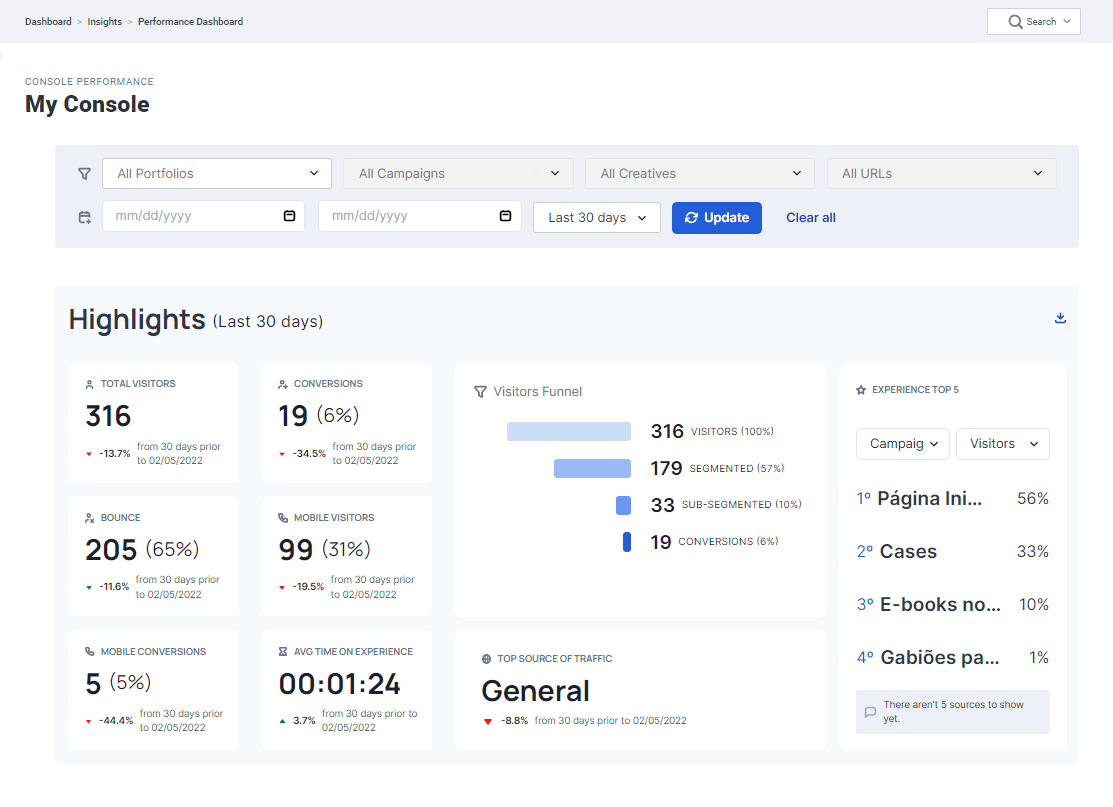
Within the Performance Dashboard page, the Highlights section is composed of a few cards like:
- Unique Visitors
- Conversions Rate
- Bounce Rate
- Average Time on the Experience
Here you will also find a new version of the Visitors Funnel, the Top Source of Traffic and a new gauge to check the Top 5 Experiences, with variable sources and metrics, depending on which level of experience you are analyzing.
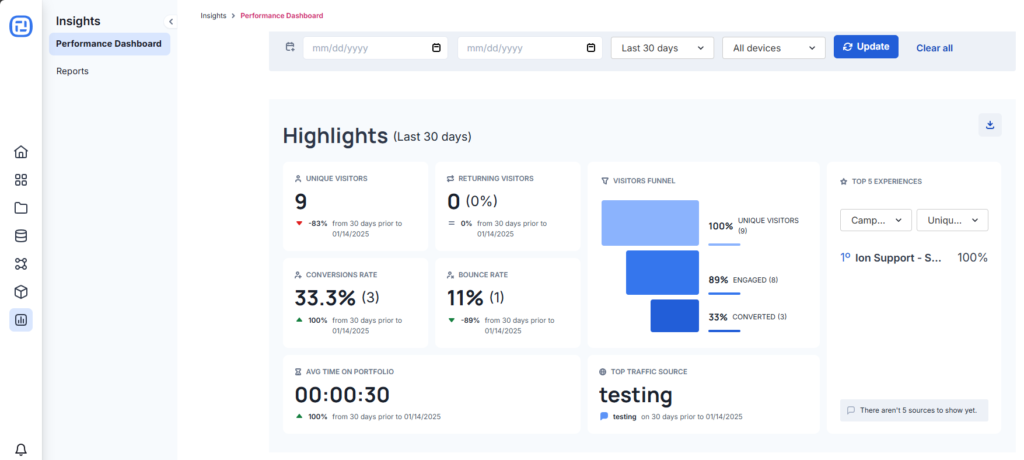
- Respondents are now Visitors;
- Converted is now Conversions.
The Reports page was kept with the same format, including the recent addition of one of the latest Ion features, Brand Spaces, as a new Report Scope, as explained here.
Schedule Reports: How to set it up
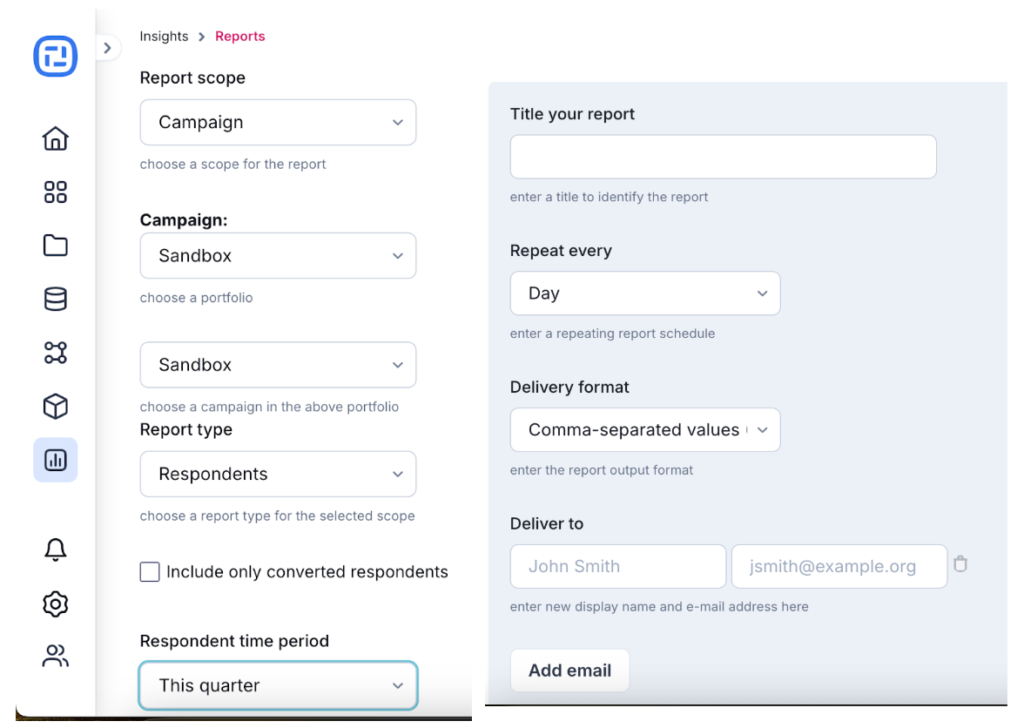
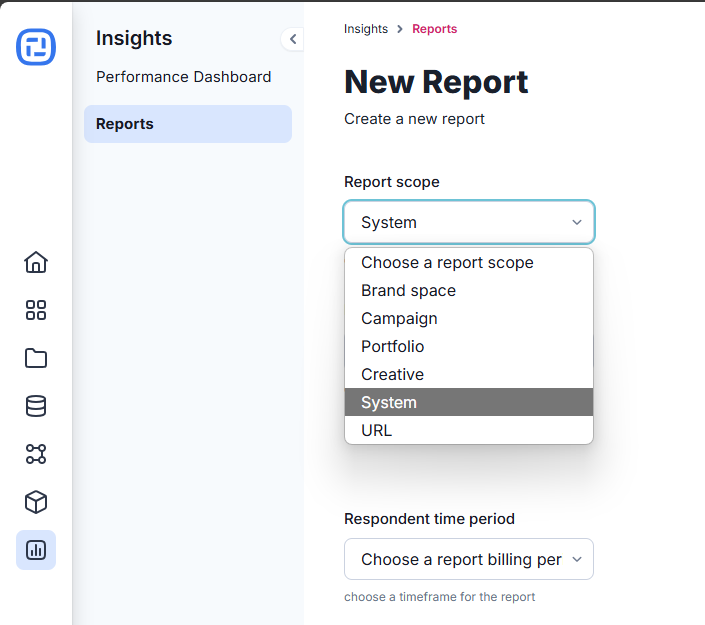
Once you click on Schedule Reports, the reports section will open up. Click on the New Report button on the top right of your screen.
New: Scheduled Respondent Data Reports
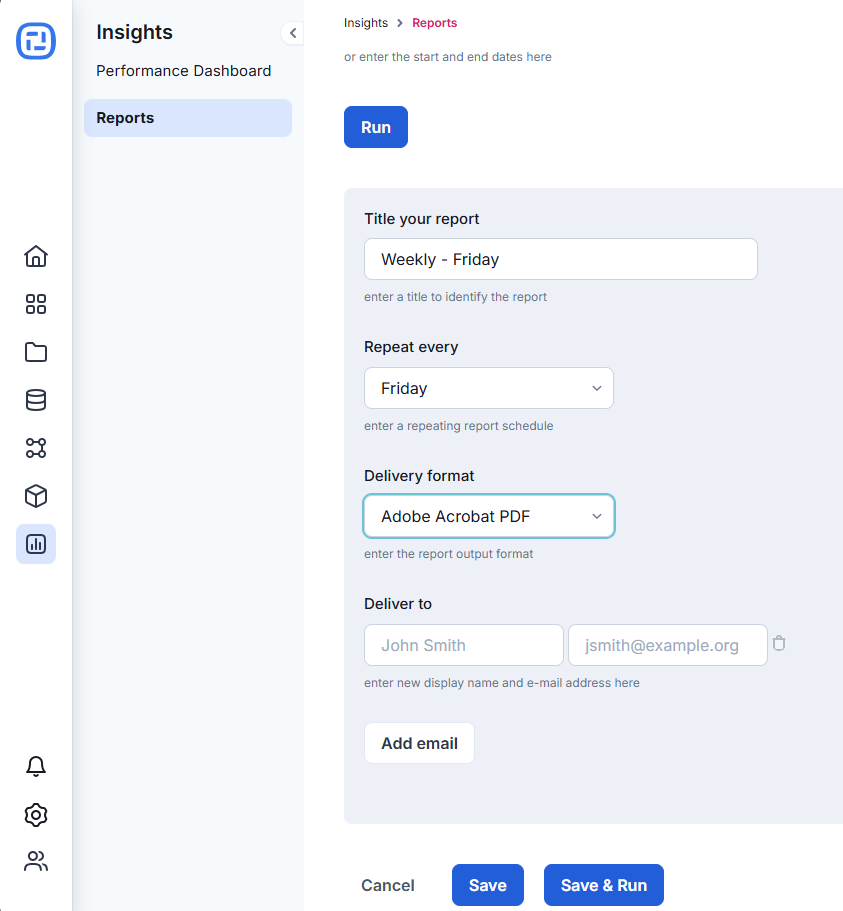
Did you know you can now schedule automated delivery of respondent data reports directly to your email inbox? This feature saves you time and ensures you have regular access to your data. Here’s how to set it up:
- Navigate to Insights.
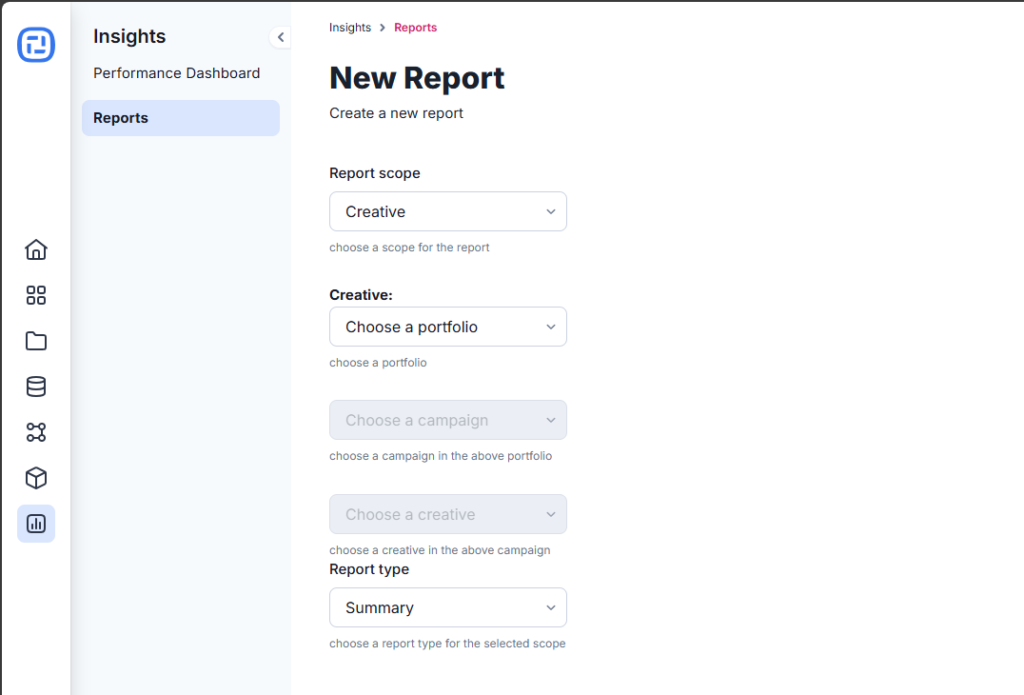
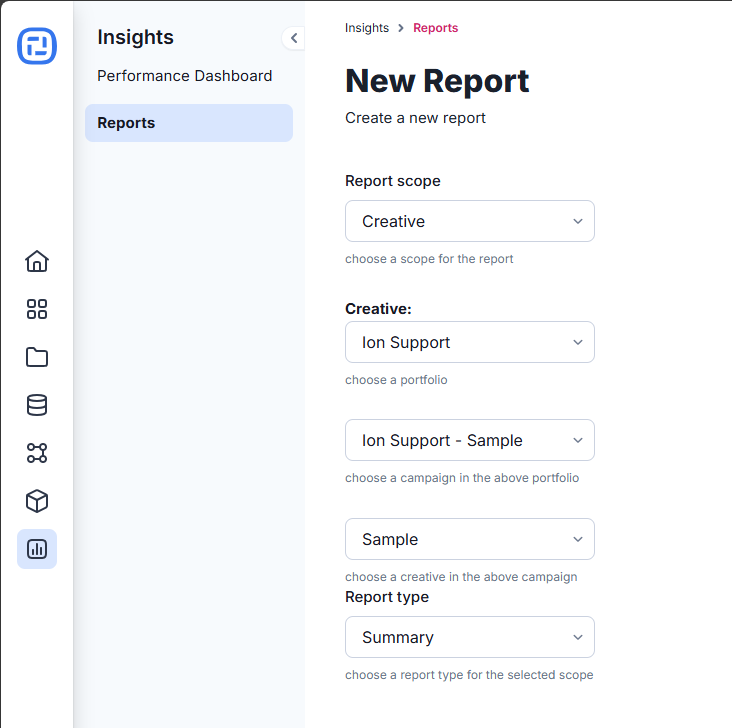
- Click on Reports and then New Report
- Select the level you wish to report on: Portfolio, Campaign or Creative
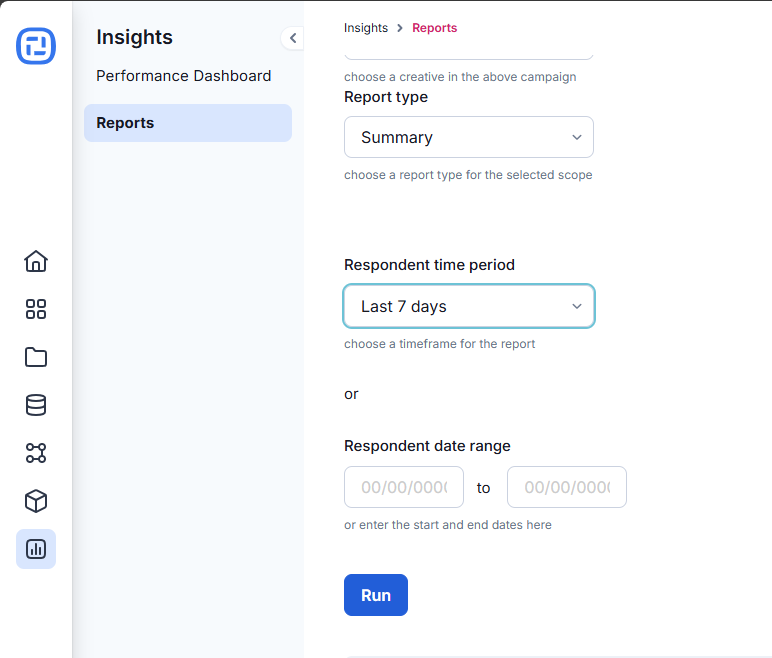
- Choose the Respondent report type and select the desired time period.
- Name your report, select the delivery frequency (e.g., daily, weekly), add one or more recipient email addresses, and click Save.
